Confirming you are not from the U.S. or the Philippines

Mit der Abgabe dieser Erklärung erkläre und bestätige ich ausdrücklich, dass:
  • Ich kein Bürger oder Einwohner der USA bin
  • Ich bin nicht auf den Philippinen wohnhaft
  • Ich weder direkt noch indirekt mehr als 10 % der Anteile/Stimmrechte/Beteiligungen der in USA ansässigen Personen besitze und/oder keine US-Bürger oder in den USA ansässigen Personen auf andere Weise kontrolliere
  • Ich mich nicht im direkten oder indirekten Besitz von mehr als 10 % der Aktien/Stimmrechte/Beteiligungen und/oder unter der Kontrolle eines US-Bürgers bzw. einer anderweitig in den USA ansässigen Person befinde.
  • Ich nicht mit US-Bürgern oder Personen mit Wohnsitz in den USA im Sinne von Abschnitt 1504 (a) des FATCA in Verbindung stehe bin
  • Ich bin mir meiner Haftung für die Abgabe einer falschen Erklärung bewusst.
Für die Zwecke dieser Erklärung werden alle von den USA abhängigen Länder und Territorien mit dem Hauptterritorium der USA gleichgesetzt. Ich verpflichte mich, Octa Markets Incorporated sowie seine Direktoren und leitenden Angestellten gegen alle Ansprüche zu verteidigen und schadlos zu halten, die sich aus einer Verletzung meiner vorliegenden Erklärung ergeben oder damit zusammenhängen.
Wir legen großen Wert auf Ihre Privatsphäre und die Sicherheit Ihrer persönlichen Daten. Wir erfassen Ihre E-Mail-Adresse nur, um Ihnen Sonderangebote und wichtige Informationen über unsere Produkte und Dienstleistungen zukommen zu lassen. Indem Sie Ihre E-Mail-Adresse angeben, erklären Sie sich damit einverstanden, solche E-Mails von uns zu erhalten. Wenn Sie den Newsletter abbestellen möchten oder Fragen bzw. Bedenken haben, wenden Sie sich bitte an unseren Kundensupport.
Octa trading broker
Konto eröffnen
Back

Gold Price Forecast: Technicians are monitoring for signs of a deceleration of the bullish correction

  • Gold bears are monitoring for a deceleration in the bullish correction, now at critical resistance. 
  • The 4-hour time frame offers a compelling picture of the market structure. 

As per the Chart of the Week analysis, the daily M-formation that was noted has played out as follows.

It was stated that ''considering the trendline support and the daily M-formation, the technicians would argue that a significant correction of the bearish impulse could be in play...''

Gold, daily chart prior analysis
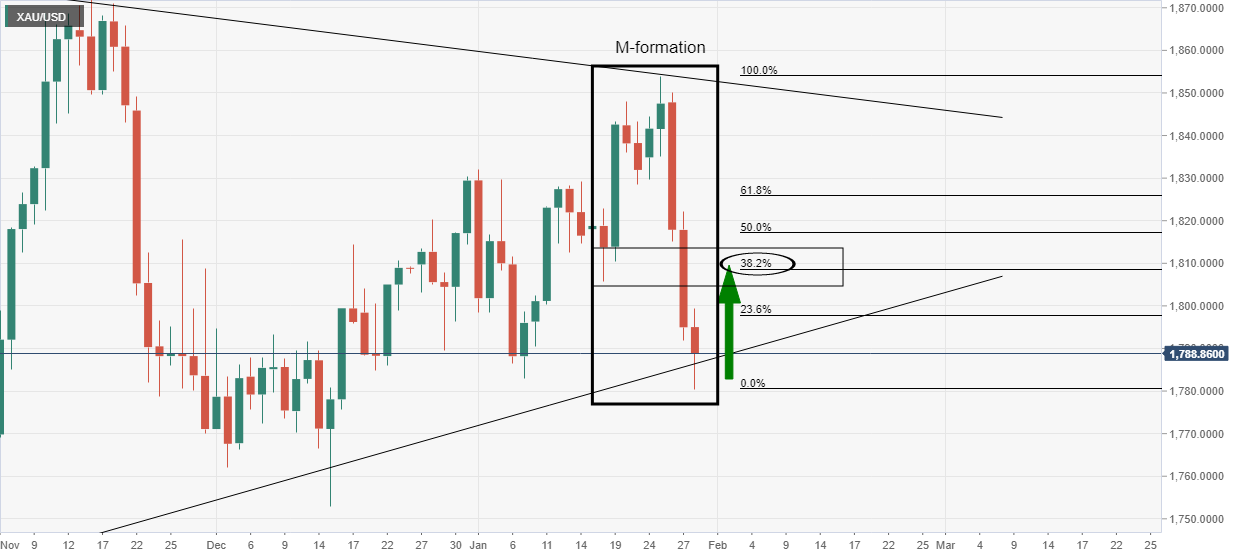
In the case above, the 38.2% Fibonacci retracement level near $1,810 was the initial target area that had a confluence with prior structure as illustrated. 

Gold, live market
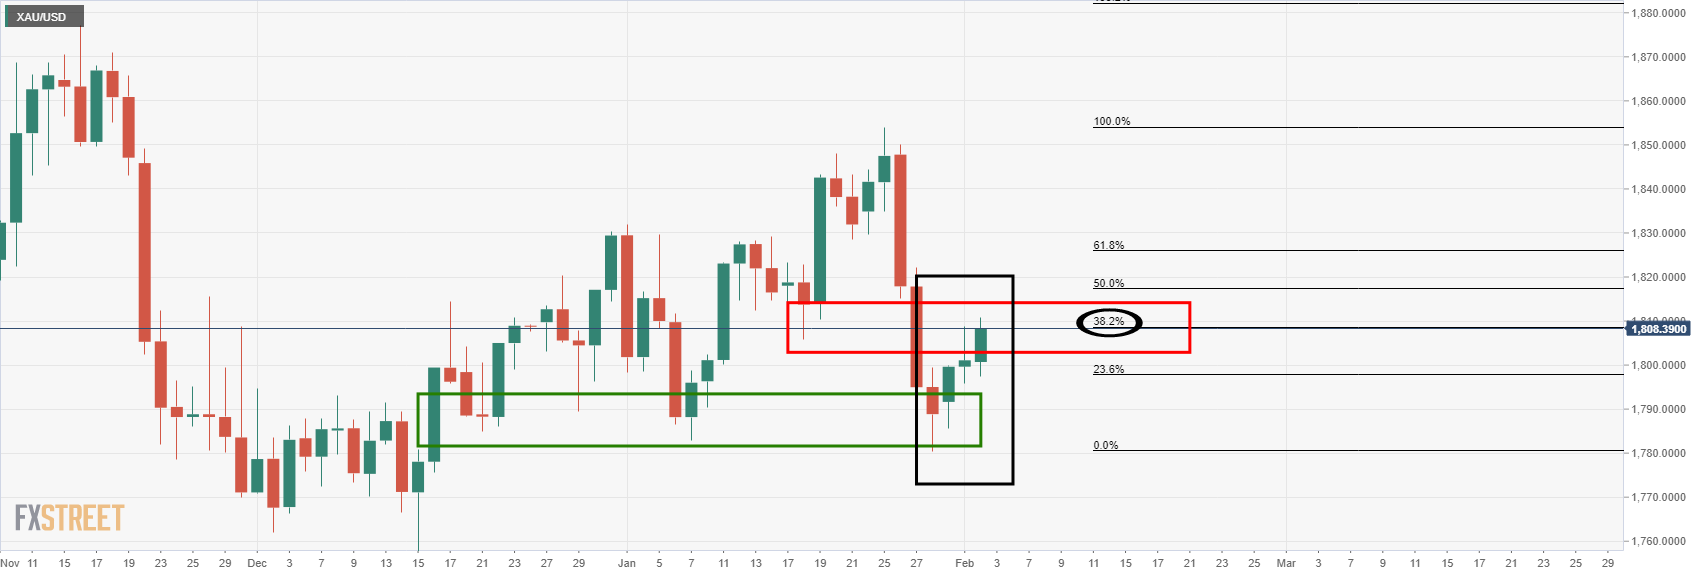
So far so good.

What bears will now want to see is a deceleration in the price action. This can be monitored from a lower time frame, such as the 4-hour chart:

In the above chart, we can see a number of interesting structures that leave a bearish bias below the $1,820's. The price would be expected to move lower to test the W-formation's neckline near $1,802 as follows:

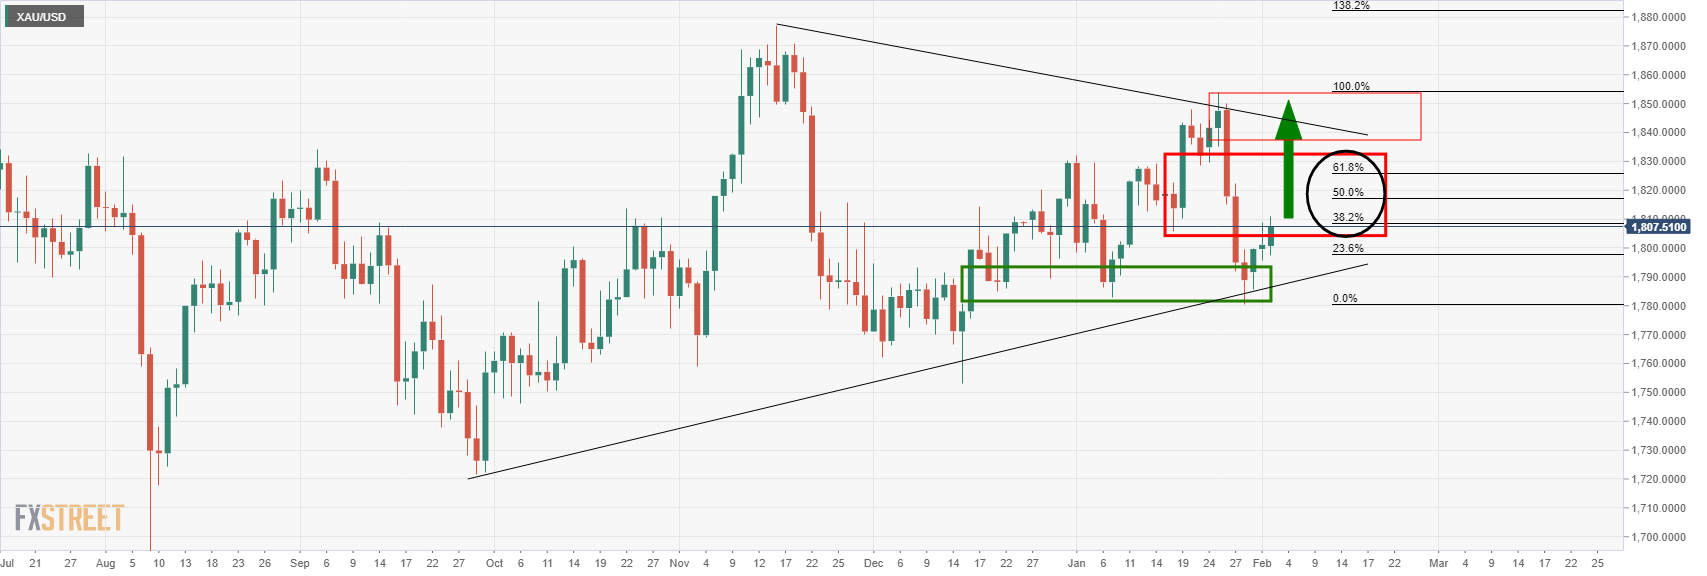
As stated at the start of the week's analysis in the Chart of the Week, ''should this playout, and if the bears commit ... additional supply could be the straw that breaks the camel's back for a sizeable continuation to crack the trendline support as follows:

On the other hand, if the US dollar gives way again, then the neckline of the M would be the last defence for a restest of the wedge resistance the $1,850's once again:
S&P 500 pushes towards 4600 as strong Google earnings extend market rally into fourth day

US equity markets enjoyed a broad-based rally for a fourth successive session on Wednesday, with the latest leg in the rebound from January’s lows dri
Mehr darüber lesen Previous

AUD/JPY Price Analysis: Failure near the 50-DMA pushed the pair beneath 82.00

On Wednesday, the Australian dollar pares losses against the low-yielder Japanese yen during the North American session. At the time of writing, the A
Mehr darüber lesen Next