Gold Price Analysis: XAU/USD needs to hold onto $1,766 to recover – Confluence Detector
- XAU/USD has been extending its losses in a long response to the Fed decision.
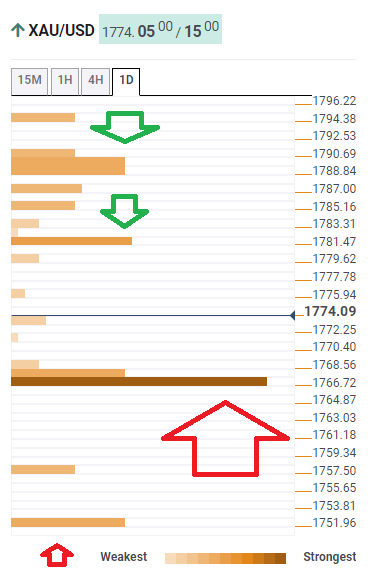
- The Confluence Detector shows that XAU/USD has considerable support at $1,766.
- Gold managing a bounce over night after an important sell signal
Where is the bottom? That is the question asked by those trading gold – and any other asset that is denominated in US dollars. The greenback's rise has been relentless following the Federal Reservel's hawkish decision on Wednesday. The world's most powerful central bank is moving toward printing fewer dollars and raising rates sooner rather than later.
The precious metal has an inverse correlation with America's currency and it is sliding despite a retreat in bond yields. How is XAU/USD positioned on the technical charts?
The Technical Confluences Detector is showing that gold has critical support at $1,766, which is the convergence of the previous month's low and the Bollinger Band one-hour lower.
Further down, a soft cushion awaits at $1,751, which is where the Pivot Point one-day Support 1 hits the price.
Looking up, initial resistance is at $1,781, which is the confluence of the Simple Moving Average 10-15m and the Fibonacci 23.6% one-day.
The next level to watch is $1,790, which is where the Fibonacci 38.2% one-day and the previous 4h-low meet up.
XAU/USD resistance and support levels
Confluence Detector
The Confluence Detector finds exciting opportunities using Technical Confluences. The TC is a tool to locate and point out those price levels where there is a congestion of indicators, moving averages, Fibonacci levels, Pivot Points, etc. Knowing where these congestion points are located is very useful for the trader, and can be used as a basis for different strategies.
Learn more about Technical Confluence