Back
25 Feb 2020
USD/JPY New York Price Forecast: Dollar vulnerable vs. yen, trades near 111.60 level
- USD/JPY is down for the third consecutive day after last week’s massive move up.
- The level to beat for bears is the 110.65/35 support zone.
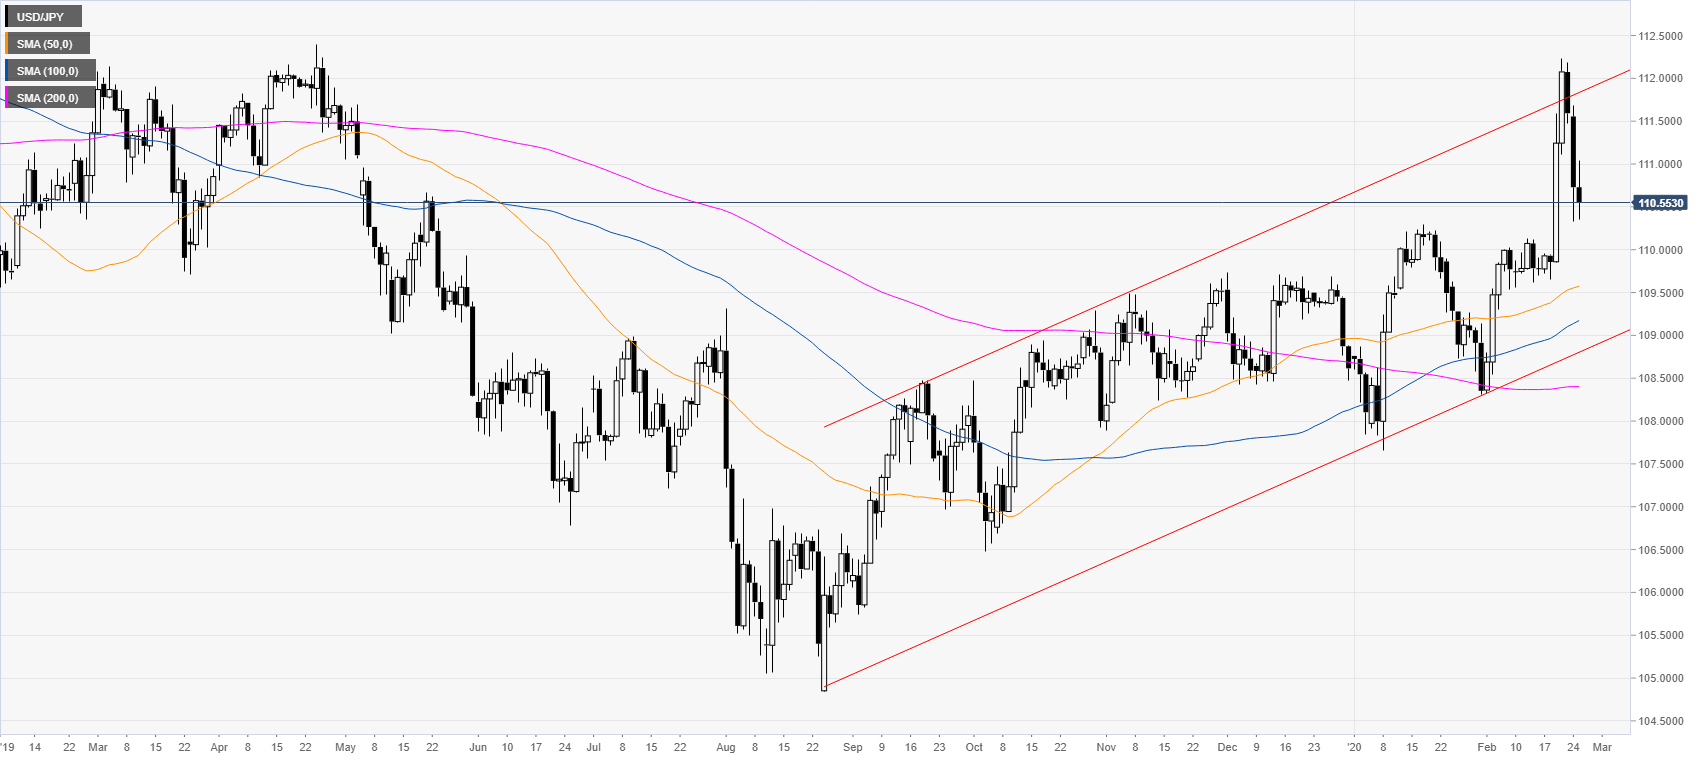
USD/JPY daily chart
USD/JPY is trading in a bull channel while above its main daily simple moving averages (SMAs). The spot is correcting down after a massive surge last week.
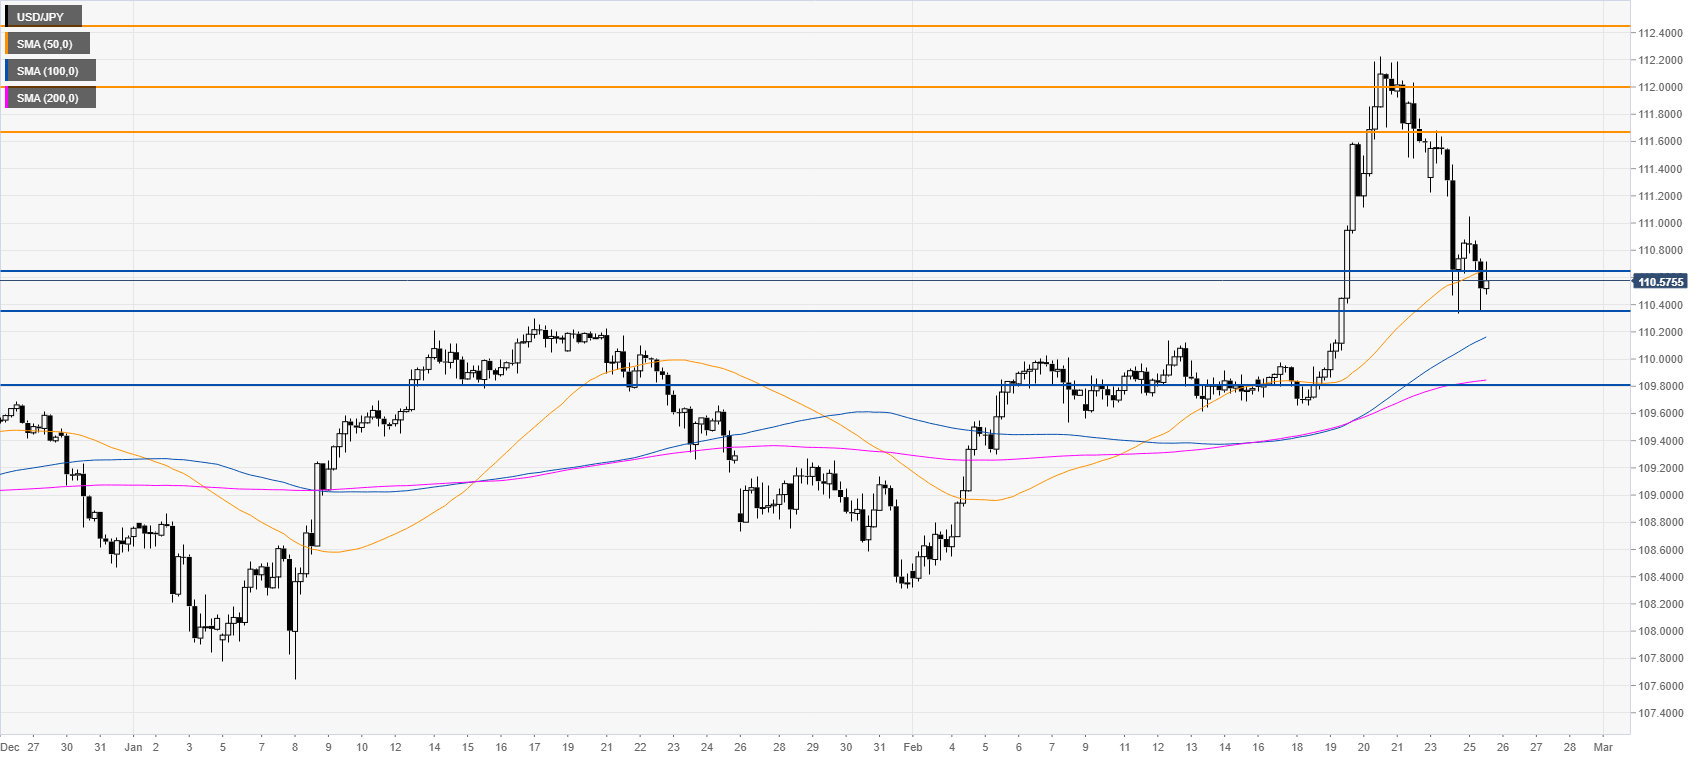
USD/JPY four-hour chart
Dollar/Yen is consolidating the Monday's losses as the spot is trading in the 110.65/35 support zone. Sellers are probably looking of an extension of the bear move to the 110.35 and 109.80 levels. Resistance can be found near the 111.65 level and the 112.00 figure, according to the Technical Confluences Indicator.
Resistance: 111.65, 112.00, 112.46
Support: 110.65, 110.35, 109.80
Additional key levels