Back
20 Feb 2020
US Dollar Index Asia Price Forecast: DXY on track to close above 2019 high, nearing the 100 figure
- DXY is trading near 45-month high as the market is approaching the 100 mark.
- Bulls are likely expecting a continuation of the bull move towards the 100.20 and 100.40 levels.
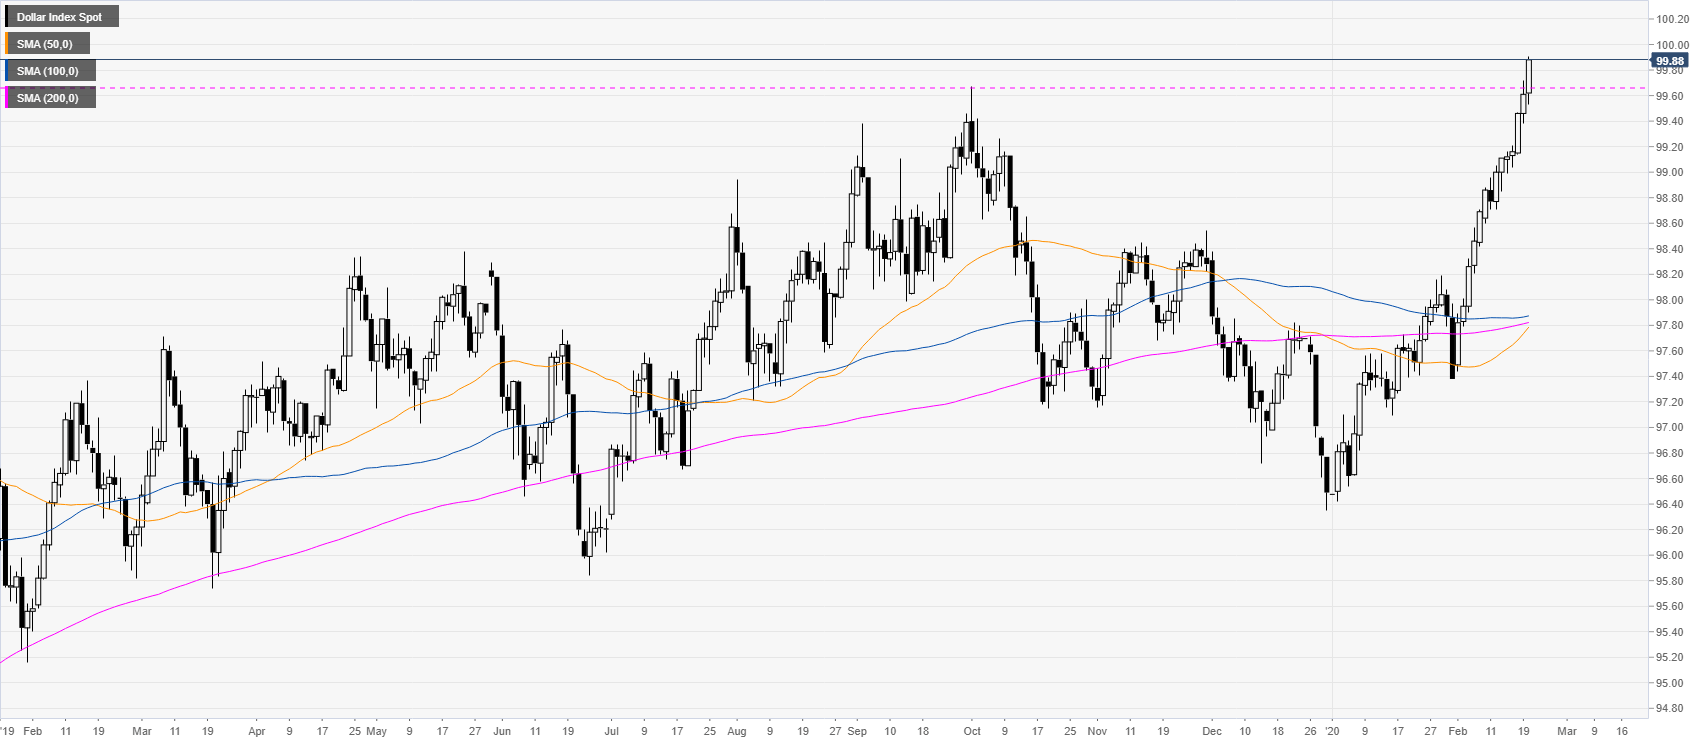
DXY daily chart
The US dollar index (DXY) is about to have a daily close above the 2019 high (at 99.67) as the market is nearing the 100 psychological level.
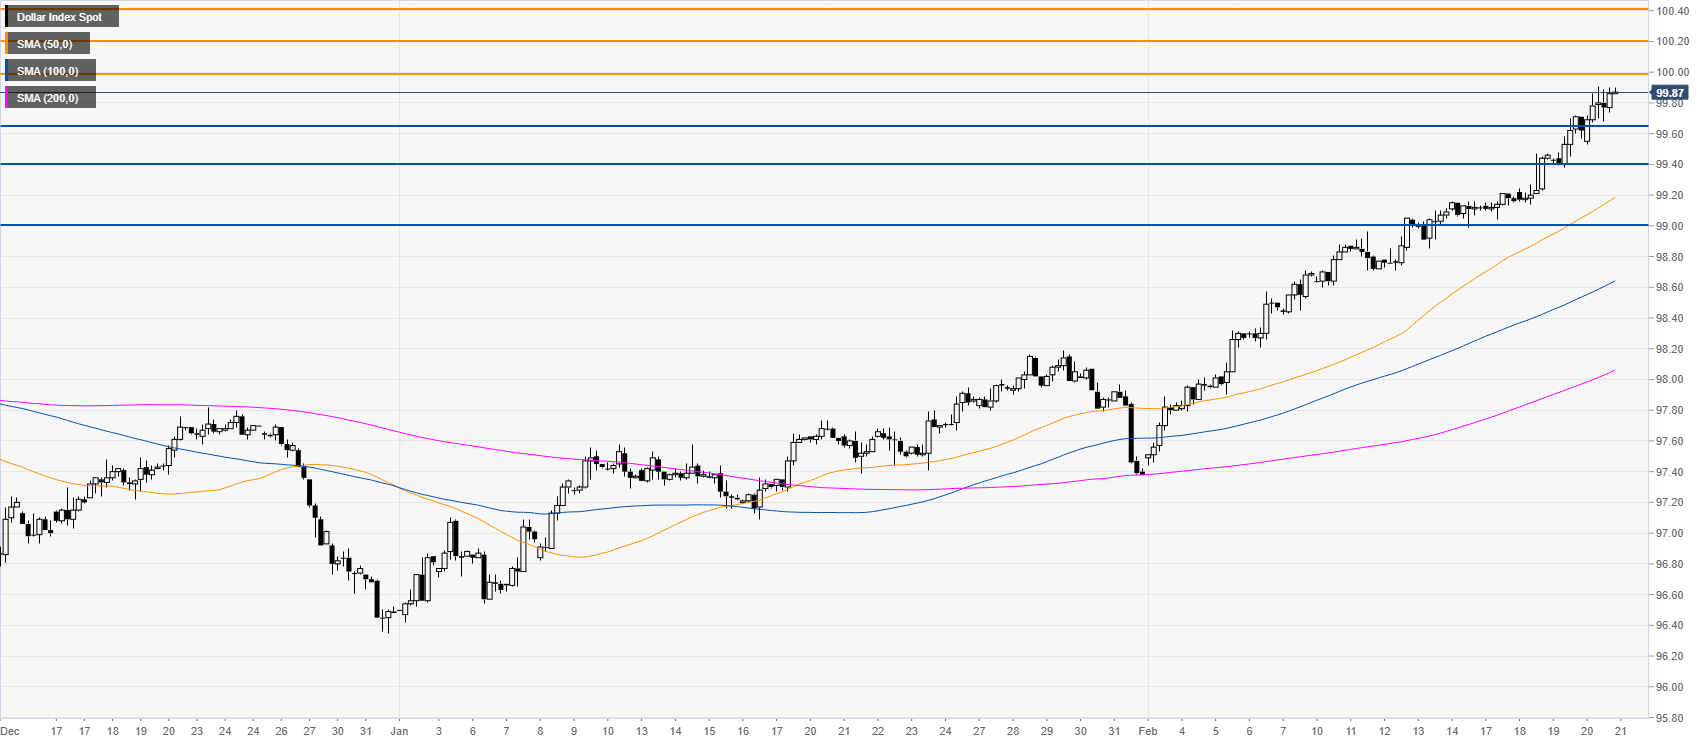
DXY four-hour chart
DXY is extending its longest run in several months as the bulls are nearing the 100 mark. The trend remains intact and a break above the above-mentioned level should expose higher levels near the 100.20 and 100.40 resistance. Support is seen near the 99.65 and 99.40 levels.
Additional key levels