Back
22 Jan 2020
EUR/USD Price Analysis: Euro remains vulnerable below 1.1118 resistance
- EUR/USD remains under pressure below the 1.1118 resistance.
- The level to beat for bears is the 1.1067 support.
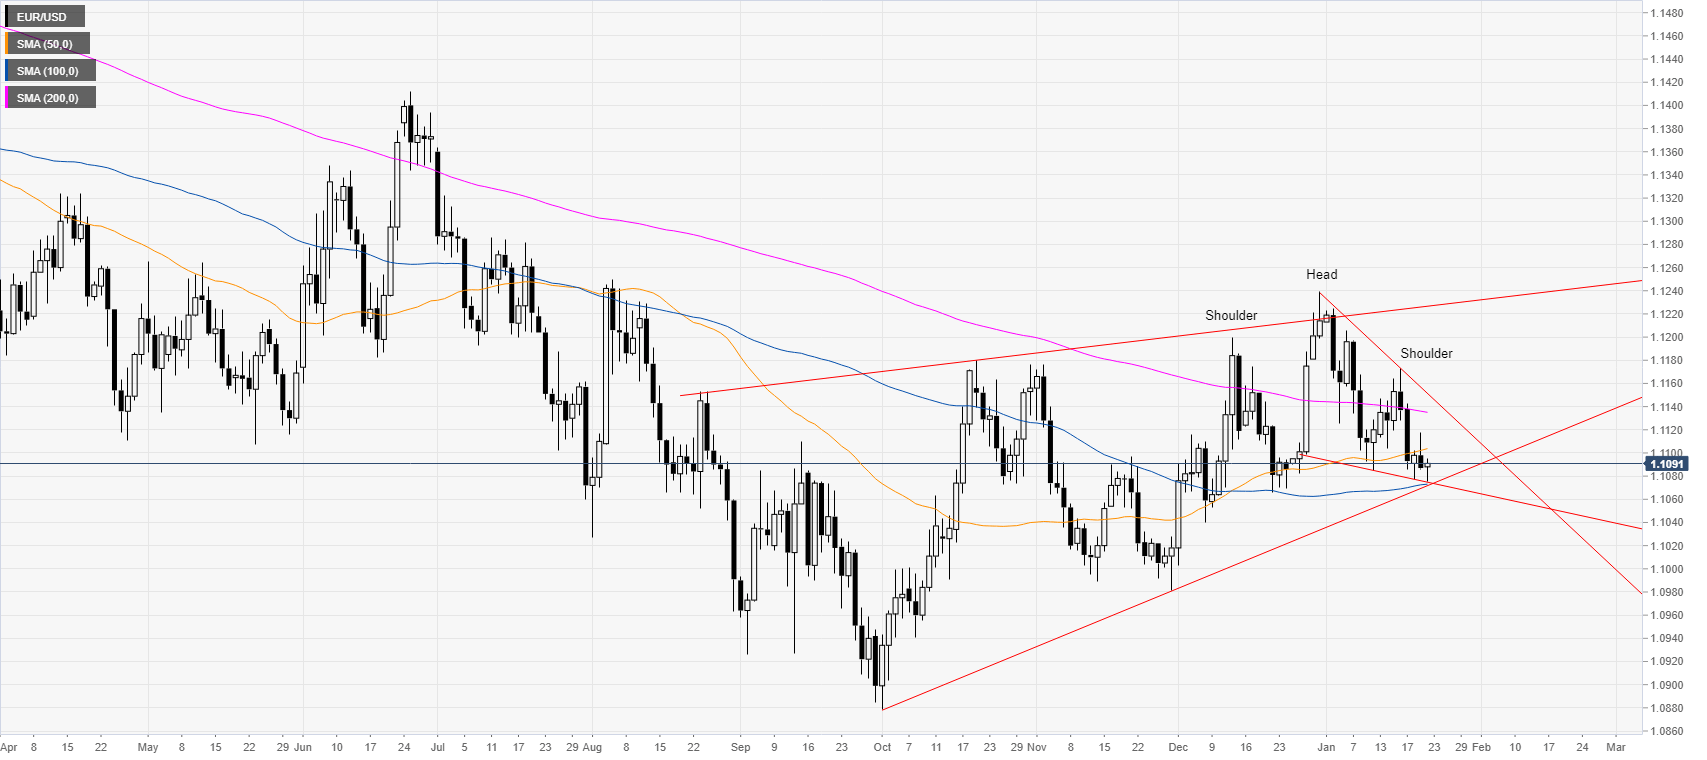
EUR/USD daily chart
EUR/USD is trading in a weak bear trend below its 50 and 200-day simple moving averages (SMAs). However, the spot is also trading in an ascending channel which originated in October 2019. Additionally, the spot is trading in a bull flag since late December 2019. EUR/USD created a head-and-shoulders pattern and a hypothetical break above the right shoulder near 1.1175 and the 200 SMA could be seen as a bullish continuation; this bullish scenario is less likely.
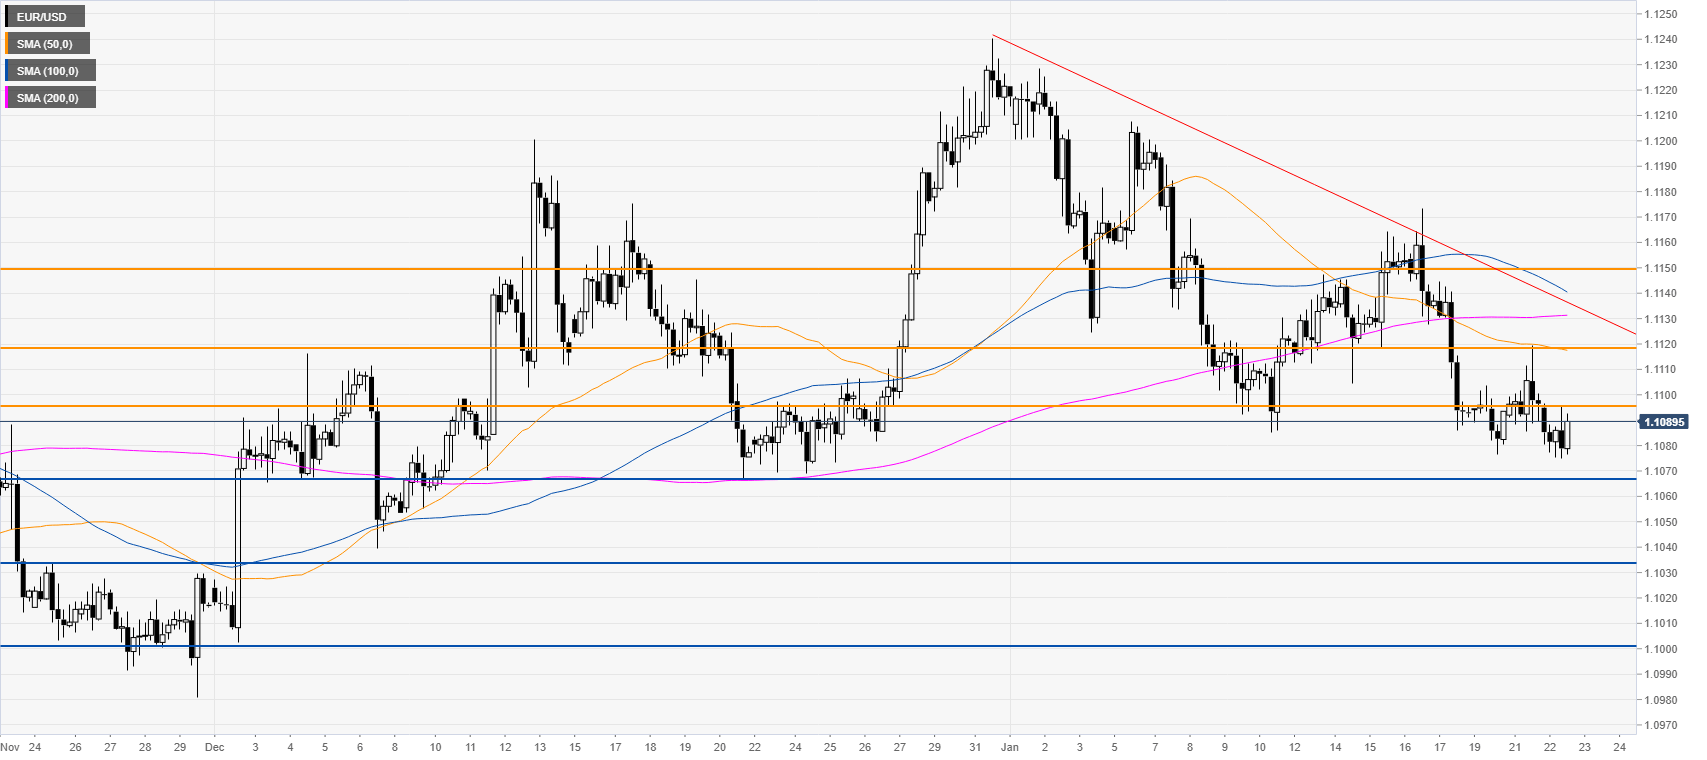
EUR/USD four-hour chart
As the spot is trading below the main SMAs the euro remains under selling pressure. Sellers are looking for a breakdown below the 1.1067 support and a potential drop to the 1.1032 and the 1.1000 figure. Resistances are seen near the 1.1095, 1.1118 and 1.1150 levels, according to the Technical Confluences Indicator.
Additional key levels