Confirming you are not from the U.S. or the Philippines

Mit der Abgabe dieser Erklärung erkläre und bestätige ich ausdrücklich, dass:
  • Ich kein Bürger oder Einwohner der USA bin
  • Ich bin nicht auf den Philippinen wohnhaft
  • Ich weder direkt noch indirekt mehr als 10 % der Anteile/Stimmrechte/Beteiligungen der in USA ansässigen Personen besitze und/oder keine US-Bürger oder in den USA ansässigen Personen auf andere Weise kontrolliere
  • Ich mich nicht im direkten oder indirekten Besitz von mehr als 10 % der Aktien/Stimmrechte/Beteiligungen und/oder unter der Kontrolle eines US-Bürgers bzw. einer anderweitig in den USA ansässigen Person befinde.
  • Ich nicht mit US-Bürgern oder Personen mit Wohnsitz in den USA im Sinne von Abschnitt 1504 (a) des FATCA in Verbindung stehe bin
  • Ich bin mir meiner Haftung für die Abgabe einer falschen Erklärung bewusst.
Für die Zwecke dieser Erklärung werden alle von den USA abhängigen Länder und Territorien mit dem Hauptterritorium der USA gleichgesetzt. Ich verpflichte mich, Octa Markets Incorporated sowie seine Direktoren und leitenden Angestellten gegen alle Ansprüche zu verteidigen und schadlos zu halten, die sich aus einer Verletzung meiner vorliegenden Erklärung ergeben oder damit zusammenhängen.
Wir legen großen Wert auf Ihre Privatsphäre und die Sicherheit Ihrer persönlichen Daten. Wir erfassen Ihre E-Mail-Adresse nur, um Ihnen Sonderangebote und wichtige Informationen über unsere Produkte und Dienstleistungen zukommen zu lassen. Indem Sie Ihre E-Mail-Adresse angeben, erklären Sie sich damit einverstanden, solche E-Mails von uns zu erhalten. Wenn Sie den Newsletter abbestellen möchten oder Fragen bzw. Bedenken haben, wenden Sie sich bitte an unseren Kundensupport.
Octa trading broker
Konto eröffnen
Back

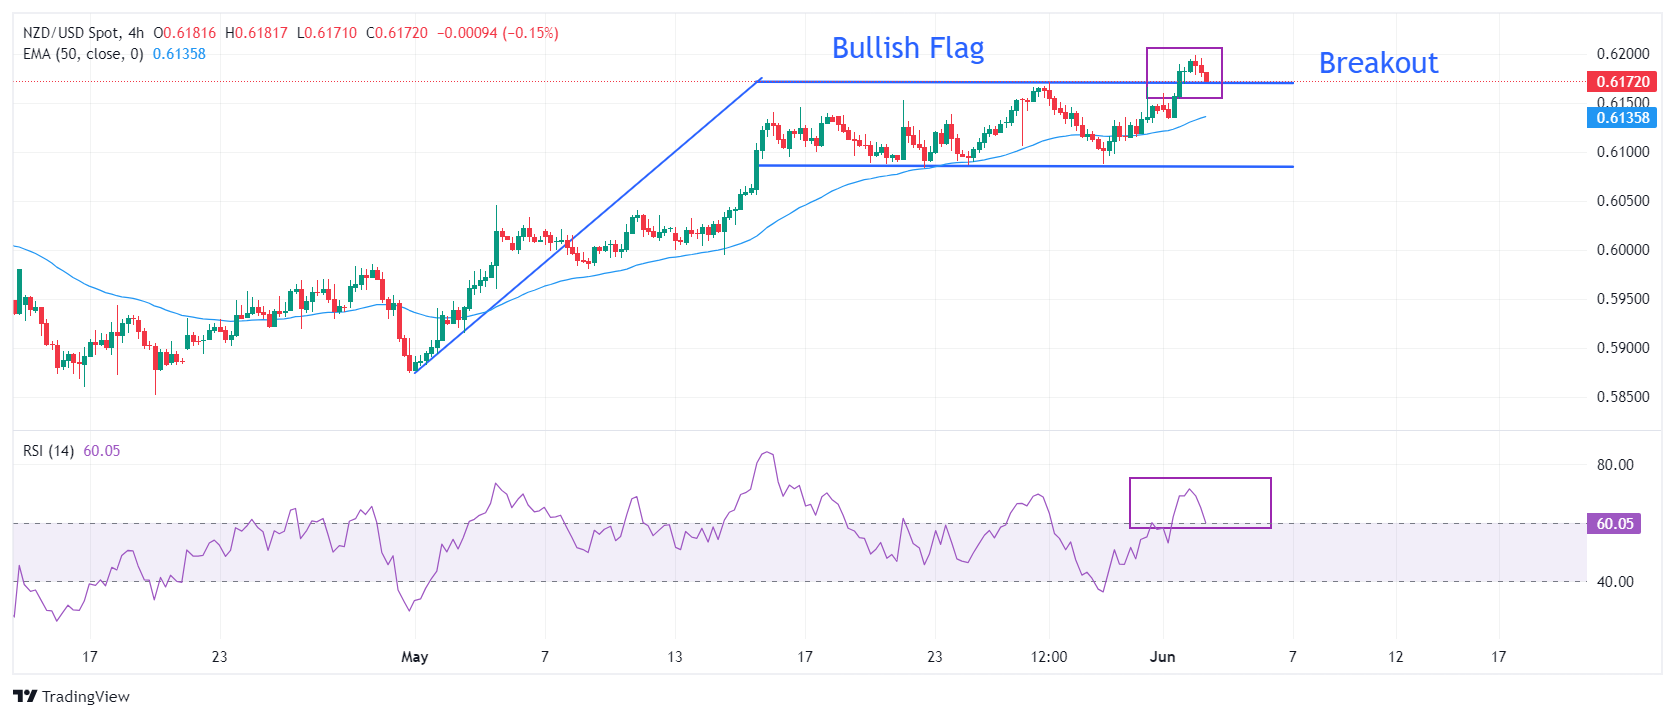
NZD/USD Price Analysis: Tests Bullish Flag breakout region

  • NZD/USD drops as the US Dollar steadies ahead of US JOLTS Job Openings data.
  • Weak US factory PMI report prompts Fed rate-cut bets.
  • NZD/USD tests the Bullish Flag breakout region near 0.6170

The NZD/USD pair corrects modestly from fresh almost three-month high of 0.6200 in Tuesday’s European session. The Kiwi asset drops as the US Dollar (USD) gains ground after a sharp sell-off move on Monday. The US Dollar Index (DXY) finds a temporary cushion near 104.00. While the broader outlook of the US Dollar remains poor amid growing speculation that the Federal Reserve (Fed) will begin lowering its key interest rates in the September meeting.

Firm speculation for Fed rate-cuts in September is boosted by diminishing confidence of investors in the United States (US) economic strength. Weak US ISM Manufacturing PMI report for May and downwardly revised Q1 Gross Domestic Product (GDP) estimates have shaken investors’ confidence.

In today’s session, investors shift focus to the US JOLTS Job Openings data for April, which will be published at 14:00 GMT. US employers are estimated to have posted 8.34 million jobs, lower than the prior reading of 8.49 million. Lower job postings suggest easing labor market conditions.

Meanwhile, the New Zealand Dollar has performed strongly in last few trading sessions as investors worry about persistent price pressures in the kiwi economy, which keeps possibility of more rates hikes by the Reserve Bank of New Zealand (RBNZ) on the table.

NZD/USD delivers a modest corrective move and tests the strength of the Bullish Flag chart pattern breakout delivered on Monday. The above-mentioned chart formation exhibits an inventory adjustment process between institutional investors and retail participants. This pattern indicates a consolidation after a sharp upside move and it generally breaks towards the direction of the trend, which in this is upwards.

The 50-period Exponential Moving Average (EMA) near 0.6126 continues to provide support to the New Zealand Dollar bulls.

Meanwhile, the 14-period Relative Strength Index (RSI) has climbed above 60.00. A sustainable move above 60.00 will strengthen Kiwi bulls further.

An upside move above the round-level resistance of 0.6200 will drive the asset January 15 high near 0.6250, followed by January 12 high near 0.6280.

On the contrary, fresh downside would appear if the asset breaks below April 4 high around 0.6050 This would drag the asset towards the psychological support of 0.6000 and April 25 high at 0.5969.

NZD/USD four-hour chart

NZD/USD

Overview
Today last price 0.6172
Today Daily Change -0.0020
Today Daily Change % -0.32
Today daily open 0.6192
 
Trends
Daily SMA20 0.6093
Daily SMA50 0.6015
Daily SMA100 0.6064
Daily SMA200 0.605
 
Levels
Previous Daily High 0.6194
Previous Daily Low 0.6133
Previous Weekly High 0.6171
Previous Weekly Low 0.6088
Previous Monthly High 0.6171
Previous Monthly Low 0.5875
Daily Fibonacci 38.2% 0.6171
Daily Fibonacci 61.8% 0.6156
Daily Pivot Point S1 0.6152
Daily Pivot Point S2 0.6112
Daily Pivot Point S3 0.6091
Daily Pivot Point R1 0.6213
Daily Pivot Point R2 0.6234
Daily Pivot Point R3 0.6274


Mexican Peso falls over 4% after landslide victory for left

The Mexican Peso (MXN) is resuming its downtrend after a brief pause on Tuesday following an over 4% decline in its key pairs on Monday.
Mehr darüber lesen Previous

USD/CAD Price Analysis: Rises toward 1.3700 despite a bearish bias

USD/CAD halts its three-day losing streak, trading around 1.3680 during the European hours on Tuesday.
Mehr darüber lesen Next